Table of Contents
- Paint Is the primary corrosion barrier
- What the degree of rusting standards specify
- The sampling gap the standards leave open
- The cost of grading rust from a sample
- Full surface capture instead of spot checks
- Assigning a rust grade to every point
- Tying coating condition to tagged equipment
- Knowing what’s not covered is a form of coverage
- Turning rust grades into a painting scope
- References
Send two experienced coating inspectors to the same run of piping on an offshore platform and ask each for a degree of rusting grade. There is a reasonable chance they return different numbers. Neither inspector is careless, and neither is wrong by the letter of the standard. The divergence comes from the method itself.
Degrees of rusting standards tell an inspector how to grade an area. They do not tell the inspector which area to grade. On a facility carrying tens of thousands of square meters of coated surface, that gap decides where the painting budget lands.
Paint Is the primary corrosion barrier
Atmospheric corrosion is the leading asset integrity threat to offshore topsides, and coating is the primary barrier standing against it. Fabric maintenance programs exist largely to manage the onset of coating degradation across a facility before the substrate is exposed.
The economics of that barrier are unforgiving in one direction. Work carried out while the coating is still intact is comparatively cheap. Once breakdown has progressed, the cost of remediation climbs by roughly an order of magnitude, and structural repair or replacement climbs further still.
That asymmetry places a heavy load on the inspection data feeding the maintenance plan. If the condition assessment is wrong, the timing of the intervention is wrong, and the operator pays on the steeper part of the curve.
What the degree of rusting standards specify
Coating condition scoring generally derives from an established industry standard. The three in common use are ISO 4628-3 (assessment of degree of rusting), ASTM D610-01 (evaluating degree of rusting on painted steel surfaces), and the European Scale of Degree of Rusting.
All three anchor to a single physical quantity: the percentage of surface area rusted. Each then maps that percentage onto its own grade scale, as shown below.
Table 1. Mapping of percentage of surface area rusted to the three degree of rusting standards in common use.
| Percentage of surface area rusted | ISO 4628-3 | ASTM D610-01 | European Rust Scale |
| Less than 0.05% | Ri 0 | 10 | Re 0 |
| 0.05% to 0.5% | Ri 1 | 9 | Re 1 |
| 0.5% to 1% | Ri 2 | 7 | Re 2 |
| 1% to 8% | Ri 3 | 6 | Re 3 |
| 8% to 40% | Ri 4 | 4 | Re 5 |
| 40% to 100% | Ri 5 | 1 to 2 | Re 7 |
The field procedure is consistent across all three. Select an area to be evaluated, commonly one square meter. Estimate the percentage of surface area rusted, along with observations on rust type and distribution. Then map that percentage to a grade.
The sampling gap the standards leave open
Two weaknesses sit inside that procedure, and both are structural rather than a matter of inspector skill.
The first is the estimate. The percentage of surface area rusted is judged by comparing the evaluation area against visual reference examples, or by the inspector’s own experience. Both routes carry a large margin of error, and both are subject to systematic bias that no amount of diligence removes.
The second is the selection. None of the standards specify where on a piece of equipment the evaluation area should be taken. An inspector examining a 40 meter pipe run chooses one square meter of it. A different inspector, on a different day, chooses a different square meter and reports a different grade. Both readings are compliant. Only one of them, at best, reflects the equipment.
Because manual inspections are targeted, the resulting data set is sparse. Findings from a handful of accessible locations are extrapolated across an entire deck or block to build a work scope. Sparse input plus subjective measurement produces a painting scope with a wide error band that nobody can quantify.
The cost of grading rust from a sample
That error band expresses itself in two directions, and both are expensive.
Overestimation produces unnecessary work. Scaffolding goes up, permits are raised, and crews blast and repaint surfaces that had serviceable coating life remaining. The budget is consumed without a corresponding reduction in risk.
Underestimation is worse. Degradation in an area that was never sampled continues unchecked. By the time it surfaces, the intervention has moved from painting to repair, at approximately ten times the cost of painting to schedule, or to steel replacement at approximately twenty times. Missed areas also drive revisit inspections, and in the worst case, they surface as unplanned shutdowns.
The problem is not that inspectors grade rust badly. It is that grading rust from a sample cannot support the decision the operator needs to make.
Full surface capture instead of spot checks
Removing the sampling problem requires removing the sample. Rather than selecting evaluation areas, the approach ABYSS uses captures the full surface of the facility and evaluates all of it.
Spherical imagery and laser scans are captured across the platform, with survey points placed approximately every 1.5 meters. Data is also captured at heights to reach elevated structure and piping. For a large deepwater spar facility, collection takes around 12 days with a team of eight.
The dense survey spacing means most equipment is imaged from several angles and ranges. Because every image is spatially located within a common frame of reference, those viewpoints are combined. Where a component is obscured from one survey point, it is usually visible from a neighboring one, which reduces the effect of obstructions and pushes coverage toward completion.
Assigning a rust grade to every point
With the facility captured, instances of coating degradation are detected in the inspection imagery using machine learning and computer vision. Associating those detections with the corresponding laser data produces a three dimensional map of coating degradation across the asset.
The measurement step then runs point by point. For each point in the cloud, the percentage of surface area rusted is calculated as the ratio of damaged surface area to total surface area within a defined neighborhood around that point. In practice, this is computed over a surface mesh within a set radius, or approximated by counting neighboring points where the cloud is uniformly sampled.
Each point then receives a degree of rusting grade using the same mapping table the standards define. The result is a point level coating condition estimate for the entire facility, rather than a single grade assigned to an area chosen by judgment.
Two properties follow from this that matter in practice. Because the grade rests on the percentage of surface area rusted alone, the same underlying measurement can be expressed against ISO 4628-3, ASTM D610-01, or the European Scale without recapturing anything. And because the point cloud is dimensioned, the output includes the physical area, extent, and location of every detected area of degradation, which is what estimating actually needs.
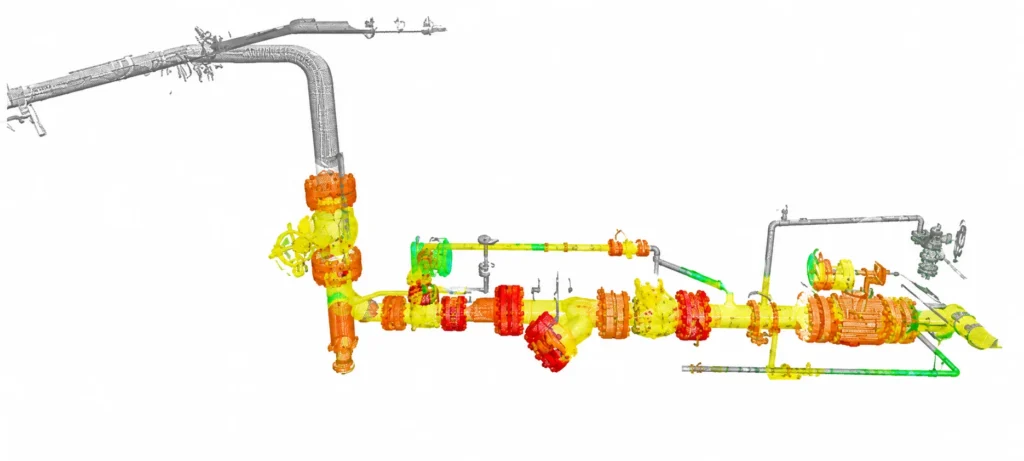
Projecting the graded points back onto the spherical imagery produces the condition overlay that inspection and integrity teams review directly.
Source: own
Tying coating condition to tagged equipment
A condition map is useful. A condition map tied to the equipment register is actionable. Within ABYSS Fabric, equipment in the scanned imagery is tagged to its Piping and Instrumentation Diagram identifier, so every detection is associated with a specific line number, vessel, or structural member.
Condition statistics are then aggregated across every viewpoint that captured a given asset. A condensing tank imaged from 22 survey points is resolved into one condition record for that tank, not 22 unrelated observations.
| Equipment | Detail | Service | Size | Group | Corrosion State | Asset Total Area (m²) | Consolidated Degree of Rusting (%) |
|---|---|---|---|---|---|---|---|
| 1-RD-97-025-B51 | Expand Line | RD | 1 | Pipe | Moderate | 1.01 | 3.05 |
| 1-RD-97-026-B51 | Expand Line | RD | 1 | Pipe | Light | 0.11 | 2.07 |
| 10-RD-97-001-F51S | Expand Line | RD | 10 | Pipe | Heavy | 7.13 | 16.28 |
| 10-RD-97-002-C51S | Expand Line | RD | 10 | Pipe | Heavy | 21.13 | 20.18 |
| 12-NG-97-005-E80S | Expand Line | NG | 12 | Pipe | Light | 8.85 | 0.36 |
| 2-FS-97-007-B51 | Expand Line | FS | 2 | Pipe | Moderate | 0.62 | 0.55 |
| 2-FS-97-034-B67 | Expand Line | FS | 2 | Pipe | Clean | 0.13 | 0 |
| 2-FS-97-045-B51 | Expand Line | FS | 2 | Pipe | Light | 0.72 | 1.38 |
| 2-FS-97-301-B58 | Expand Line | FS | 2 | Pipe | Clean | 0.33 | 0 |
| 2-GD-97-003-B51 | Expand Line | GD | 2 | Pipe | Moderate | 2.16 | 3.87 |
| 2-GD-97-221-B51 | Expand Line | GD | 2 | Pipe | Moderate | 3.46 | 0.53 |
| 2-HD-97-008-B51 | Expand Line | HD | 2 | Pipe | Clean | 1.03 | 0 |
| 2-HD-97-009-B51 | Expand Line | HD | 2 | Pipe | Light | 0.65 | 1.98 |
| 2-HD-97-013-B51 | Expand Line | HD | 2 | Pipe | Heavy | 8.70 | 1.16 |
| 2-HD-97-015-B51 | Expand Line | HD | 2 | Pipe | Clean | 0.10 | 0 |
| 2-HD-97-017-B51 | Expand Line | HD | 2 | Pipe | Heavy | 4.89 | 2.26 |
| 2-HD-97-023-B51 | Expand Line | HD | 2 | Pipe | Clean | 0.26 | 0 |
| 2-HD-97-024-E80S | Expand Line | HD | 2 | Pipe | Light | 0.79 | 2.21 |
| 2-HD-97-043-B80 | Expand Line | HD | 2 | Pipe | Light | 2.30 | 0.80 |
| 2-HD-97-309-B58 | Expand Line | HD | 2 | Pipe | Moderate | 1.05 | 0.88 |
The result is a sortable, filterable register of the whole facility. An integrity engineer can query every high pressure gas line carrying an Ri 5 condition, or filter by pipe diameter, service designation, or deck. Each record links back to the inspection imagery, so any grade can be verified visually from multiple angles through a walkthrough of the captured facility.
Knowing what’s not covered is a form of coverage
Full coverage is the target, not a guarantee. Confined spaces, tightly packed pipe racks, and concealed equipment remain difficult to survey, and no capture method reaches everything.
What changes is visibility of the shortfall. Captured data is compared against the as-built model of the facility, and areas with no coverage are flagged explicitly by equipment or by location. Those gaps are then routed for follow up manual inspection to satisfy regulatory requirements. The goal is always complete coverage, but knowing what has been missed is also a form of coverage.
Turning rust grades into a painting scope
The point of objective condition data is the work it produces. Within Fabric, assessed equipment is assembled into work packs by severity and service class, for example every four inch and six inch hydrocarbon and hazardous fluid line carrying an Ri 5 grade, issued against a work order and permit.
Assessments can sit in more than one work pack, so painting, non destructive testing, and construction teams draw from the same condition record and can cross reference each other’s scope. Because the underlying measurement carries physical area, material volumes and labor estimates follow from the data rather than from extrapolation.
The facility can also be broken into decks, blocks, or areas with aggregate condition quantified for each, which lets planners direct remediation at the locations carrying the highest total degradation instead of the locations that happened to be inspected.
Traditional walkthrough inspections will continue to have a role, and experienced inspectors remain central to interpreting what the data shows. What changes is the foundation beneath the decision. A coating condition assessment that covers the full surface, applies one consistent measurement everywhere, and ties every grade to a tagged piece of equipment gives an operator something a sampled estimate cannot: a defensible answer to how bad it is, where, and what it will take to fix.
References
- ASTM International. (2001). Standard test method for evaluating degree of rusting on painted steel surfaces (ASTM D610-01).
- Ferguson, E. L., Dunne, T., Windrim, L., Bargoti, S., Ahsan, N., & Altamimi, W. (2021, noviembre). Automated painting survey, degree of rusting classification, and mapping with machine learning. Abu Dhabi International Petroleum Exhibition and Conference, Abu Dhabi, Emiratos Árabes Unidos.
- International Organization for Standardization. (2016). Paints and varnishes, Evaluation of degradation of coatings , Part 3: Assessment of degree of rusting (ISO 4628-3).