Table of Contents
- 7 QC tools in the inspection cycle
- Inspection rejections: Four populations
- Quality control before statistical analysis
- Pareto and Ishikawa to decide where to act
- Histograms, scatter, and statistical control
- Technical application according to the NDT method
- How to reduce rejections without losing detectability
- Conclusions
- References
The 7 QC tools (Quality Control) offer a methodology to separate real defects from Non Destructive Testing (NDT) process failures before attributing a high rejection rate to the quality of the inspected product. Coverage losses, invalid calibrations, misinterpreted geometric signals, insufficient image quality, or untraceable records can prevent component release without a rejectable condition necessarily existing.
When these events are consolidated as “defective product,” the organization repairs where it should have corrected the inspection and repeats tests without eliminating the cause. The goal is to convert data into technical actions that reduce defects, retests, and false calls, without degrading detectability or increasing the risk of false acceptance.
7 QC tools in the inspection cycle
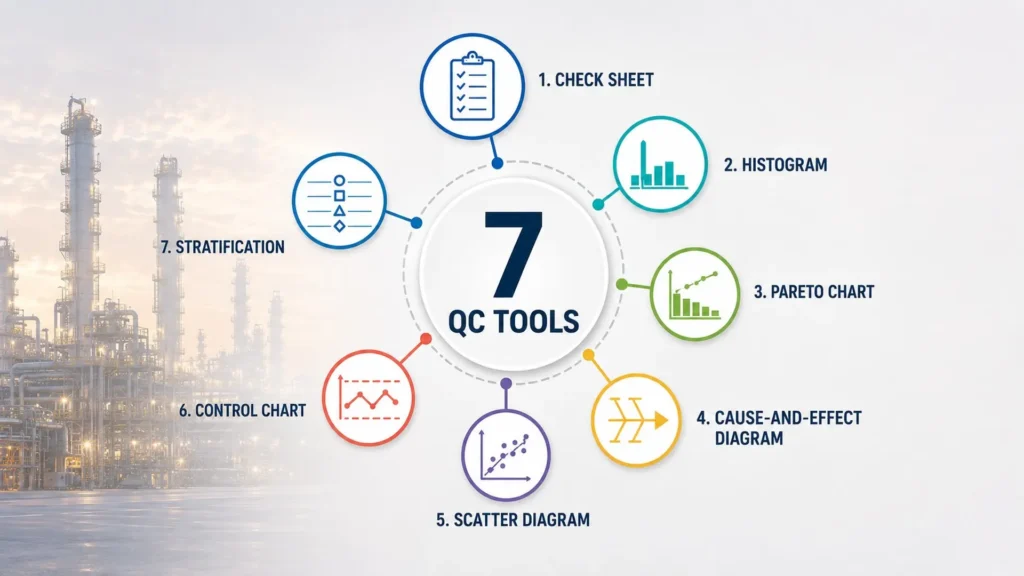
The seven basic quality tools comprise check sheet, stratification, histogram, Pareto chart, cause-and-effect diagram, scatter diagram, and control chart. The American Society for Quality (ASQ) notes that the seventh tool can vary between stratification, flowchart, and run chart. In this article, stratification is maintained because it allows separating results by method, equipment, inspector, or geometry before comparing rejections.
In industrial inspection, each tool must answer an operational question:
- Check sheet: What happened and under what conditions?
- Stratification: On which method, equipment, inspector, or geometry is it concentrated?
- Histogram: How are the measurements distributed?
- Pareto chart: Which loss dominates by frequency or impact?
- Ishikawa diagram: Which technical causes must be verified?
- Scatter diagram: Which variables seem to change together?
- Control chart: Does the process remain stable or has it changed over time?
These quality tools analyze the process, but they do not replace the applicable code, specification, or procedure. ASTM E1316-26a establishes that an indication must be interpreted as false, non-relevant, or relevant before evaluating material acceptance or rejection.
The following video explains the application of the seven QC tools to analyze problems and control process variation. Source: Quality Engineer Stuff
Inspection rejections: Four populations
The first methodological error consists of calling any event that prevents releasing a component a “rejection.” Before calculating percentages or initiating corrective actions, four populations must be separated:
| Result | What does it represent? | Process to be investigated |
| True rejection | Relevant indication that fails applicable criteria | Manufacturing, welding, or degradation |
| False call | Response initially evaluated as rejectable that does not correspond to an unacceptable condition | Technique, sensitivity, geometry, or interpretation |
| Invalid test | Examination without sufficient evidence due to coverage, calibration, coupling, or image issues | NDT procedure, equipment, and execution |
| Documentation failure | Result that cannot be demonstrated due to incomplete records or loss of traceability | Data management and review |
The quality manager, NDT manager, and manufacturing personnel must separately analyze each population before defining corrective action. This segregation allows directing the investigation toward the process that has the actual capacity to control the deviation.
Classification changes the solution. Repairing a weld does not correct an out-of-tolerance calibration. Re-qualifying welders does not recover an incomplete PAUT file. Repeating a radiography does not eliminate the cause of a lack of fusion.
A reduction in rejections may seem favorable, even if sensitivity has been reduced, coverage omitted, or interpretation relaxed. In addition to the rejection rate, it is advisable to monitor re-inspections, discrepancies between evaluators, returned files, and omissions detected during independent reviews.
Quality control before statistical analysis
The check sheet must define the objective, time period, counting unit, and person responsible for data collection; in addition, it must record process variability rather than being limited to “accepted” or “rejected.” In UT, it may include transducer, angle, wedge, gain, calibration, surface condition, and coverage; in RT, exposure technique, image quality indicator, identification, acquisition system, and reason for repetition.
ISO/IEC 17020:2026 establishes requirements for competence, impartiality, and consistent operation of inspection bodies. ISO 9712:2021 defines qualification and certification requirements for NDT personnel. Even so, the organization must demonstrate that its specific application generates traceable and technically reliable results to support acceptance or rejection decisions.
Personnel competence is essential, but the quality of the inspection service also depends on procedure consistency, data traceability, and the reliability of each decision.
Stratify before comparing
Stratification separates data by variables capable of altering the result: method, inspector, shift, contractor, material, thickness, geometry, equipment, probe, consumable batch, or environmental condition. A stable overall rate may hide the fact that most invalid tests occur with a specific setup or on a given geometry.
Comparisons must preserve the denominator and difficulty level. Ten repetitions in one hundred joints are not equivalent to ten in one thousand, nor is it valid to compare complex geometries with repetitive components.
Verify the measurement system
Before interpreting histograms or trends, the capability of the measurement system must be verified. ISO 10012:2026 demands confidence in the validity and reliability of results, while ISO 5725-2:2025 provides the basic method for estimating repeatability and reproducibility in continuous results. The latter is limited to methods that provide a value on a continuous scale.
For thickness, length, height, or amplitude, readings can be repeated with the same inspector and then with different inspectors or equipment. For categorical decisions, it is advisable to conduct independent reviews and compare detection, classification, sizing, and judgment.
A calibration certificate does not correct unstable coupling, non-repeatable positioning, or inconsistent interpretation. If this variation is not separated, the Pareto chart may end up prioritizing inspection system noise as if it were product variation.
Pareto and Ishikawa to decide where to act
The Pareto chart is constructed after classifying and stratifying. An overall Pareto chart of “rejections” mixes losses with different responsible parties and solutions. The most useful practice consists of preparing independent analyses:
- Discontinuity Pareto: lack of fusion, porosity, cracks, or other rejectable conditions.
- Invalid test Pareto: signal loss, insufficient coverage, decalibration, or image quality issues.
- Documentation Pareto: incorrect identification, missing metadata, incomplete files, or wrong review.
The first analysis directs action toward manufacturing; the second, toward NDT execution; the third, toward data management. Priority should not be evaluated solely by frequency: lost hours, cost, radiation exposure, and release delays can modify it.
Ishikawa with verifiable hypotheses
The Ishikawa diagram organizes potential causes, but it does not confirm the root cause. The effect must be formulated precisely: “PAUT coverage loss in a thickness range” allows for investigation; “many rejections” lacks sufficient definition.
The branches can be adapted to the process:
- Method: incomplete scan plan or ambiguous criteria.
- Equipment: worn wedge, unstable encoder, or defective detector.
- Measurement: incorrect reference, inadequate gain, or low resolution.
- Personnel: execution or interpretation differences.
- Material and geometry: roughness, misalignment, or geometric reflections.
- Environment: temperature, lighting, access, or operational interference.
Each hypothesis must be tested through file review, controlled retesting, configuration comparison, field observation, or independent evaluation. The investigation can be closed when the confirmed cause explains the effect and the applied action reduces its recurrence.
Histograms, scatter, and statistical control
The histogram shows the distribution of thicknesses, amplitudes, lengths, or deviations. A wide distribution can represent real variability; two concentrations can reveal populations mixed by material, equipment, or campaign. It should be applied after stratifying.
The scatter diagram explores relationships between variables: roughness and coupling loss, scan speed and missing data, or thickness and reading difference. A visual correlation does not prove causality. The relationship should be reviewed by groups and, when possible, through controlled changes.
Control charts incorporate time and help distinguish common variation from signals associated with special causes. ASTM E2587-25 is the current standard practice for the use of control charts in statistical process control.
In inspection, the following can be used:
- P chart: proportion of invalid tests when the inspected volume changes.
- NP chart: number of events when sample size remains constant.
- X̄-R charts: average and range of continuous measurements organized into subgroups.
Control limits describe statistical stability; specification limits determine technical acceptability. A process can be stable and produce unacceptable results, or temporarily comply while developing a trend. Chart selection depends on data type, sample size, and subgroup formation, not on the available template.
Technical application according to the NDT method
In UT, PAUT, and TOFD, real discontinuities must be separated from geometric signals, loss of coupling, incomplete coverage, encoder errors, invalid calibrations, and incomplete files. A concentration of false calls near the root requires reviewing geometry, angle, sensitivity, and criteria before attributing the problem to welding.
In film radiography, computed radiography, and digital radiography, component defects must be distinguished from retests due to coverage, geometry, movement, image quality indicator, identification, or acquisition. Optical density corresponds to film; in digital systems, contrast, signal-to-noise ratio, spatial resolution, processing, and artifacts become more important.
In liquid penetrant and magnetic particle testing, surface preparation and viewing conditions modify the outcome. Cleaning, dwell and removal times, developing, lighting, magnetization, field direction, and bath concentration must be recorded as process variables. A non-relevant accumulation should not automatically be counted as a defect.
The practical solution is to design check sheets and specific categories for each method. A generic list eliminates the variables needed to locate the source of the rejection.
How to reduce rejections without losing detectability
The integrated application of the 7 QC tools makes it possible to link each population to the process that can correct it and sustain an evidence-based reduction in rejections:
- Define true rejection, false call, invalid test, and documentation failure.
- Record technical variables and metadata from the origin.
- Stratify before comparing rates, inspectors, or vendors.
- Verify repeatability, reproducibility, or inter-evaluator agreement.
- Construct separate Pareto charts and prioritize by impact/consequence.
- Verify Ishikawa hypotheses with evidence.
- Monitor recurrence and stability using control charts.
Corrective action does not end when reviewing a procedure or providing training. It must be verified using the indicator that revealed the problem and through an independent sample. If false calls decrease but the omission of relevant indications increases, the action is not effective. If inspection rejections drop while invalid tests grow, the loss simply shifted categories.
The operational benefit is direct: fewer unnecessary repairs, fewer NDT retests, faster releases, better use of specialists, and defensible data during audits. Technical authority is demonstrated by explaining why the rejection occurred, which process must be corrected, and how the improvement was verified.
Conclusions
The 7 QC tools gain value when they connect evidence, cause, and decision within the inspection process. Separating true rejections, false calls, invalid tests, and documentation failures prevents attributing losses originating from technique, equipment, interpretation, or traceability to manufacturing. From that classification, quality control prioritizes deviations, tests hypotheses, and verifies whether the applied action alters performance.
A lower rejection rate lacks technical value when obtained by reducing sensitivity, accepting insufficient coverage, or weakening evaluation criteria. Real improvement occurs when rework and retests decrease while preserving detectability, reproducibility, and the reliability of each decision regarding the component and its operational continuity.
References
- American Society for Quality. Seven basic quality tools. ASQ.
- ASTM International. Standard terminology for nondestructive examinations (ASTM E1316-26a). ASTM International.
- ASTM International. Standard practice for use of control charts in statistical process control (ASTM E2587-25). ASTM International.