Table of Contents
- Large-diameter pipe inspection: The challenge
- Guided Wave Screening: Locating damage
- Case study: Two 36-inch lines
- Locating indications at the 6 o'clock position
- Guided Wave Scanning: Measuring remaining wall thickness
- From frequency‑time analysis to wall‑thickness profile
- From results to integrity decisions
- Advancing large-diameter scanning: QSR®-ALF
- References
Localized corrosion in large-diameter pipes presents a challenge that begins before any measurement is taken: how can small areas of severe wall loss be located across hundreds of square meters of surface? Manual UT measurements will provide highly accurate remaining wall thickness but can only economically be used to cover a small percentage of the overall structure.
A case documented by Guided Ultrasonics Limited (GUL) on two 36‑inch lines demonstrates a different strategy: use guided wave screening to detect and locate indications, then use guided wave scanning where the findings show measurement is needed. The strength of the approach lies in separating detection from sizing, using each where it adds the most value.
Large-diameter pipe inspection: The challenge
A 36‑inch pipe has a circumference of approximately 2.9 meters. When that surface extends along a line between a tank and a jetty, building a sufficiently dense UT measurement grid can significantly increase the number of inspection points, surface preparation, access requirements, and acquisition time.
The challenge increases when deterioration is highly localized. Numerous points may show acceptable thickness while a deep pit between two measurement positions can define the fitness for service of the pipe. Therefore, simply increasing the number of points does not guarantee detection of the wall loss that matters most to integrity.
An efficient inspection strategy must address two different needs. The first is to examine as much of the pipe as possible, along its length and around its circumference, to locate areas of concern. The second is to obtain sufficiently detailed wall-thickness information in those areas, including where direct access may be difficult.
Guided Wave Screening: Locating damage
The Guided Wave Testing (GWT) used for screening introduces guided waves that propagate axially along the pipe within the full volume of its wall. Changes in cross‑section generate responses, allowing long lengths to be examined from a single test position, with damage accurately located and classified by severity.
ASTM E2775‑16 (2023) defines GWT specifically as a screening tool: it locates areas where wall loss may be present, but it does not directly provide wall thickness or the exact defect dimensions. ISO 18211:2016 follows the same principle, defining GWT as a qualitative method for screening and locating areas that may be affected by corrosion or erosion. When a possible discontinuity is identified, follow‑up testing is normally required to obtain detailed information.
This distinction is important in practice. The amplitude of the screening response cannot be directly correlated to millimeters of remaining wall thickness. The results do indicate the relative significance of the cross‑sectional change and its approximate circumferential extent, allowing indications to be classified by severity and prioritized for detailed characterization.
Case study: Two 36-inch lines
The case published by GUL concerns two parallel 36‑inch lines connecting a tank to a jetty, with a history of corrosion at the 6 o’clock position, including previous leaks. The lines included sections of spiral‑welded and longitudinal‑seam pipe. The scope required 100% inspection coverage.
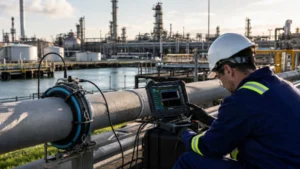
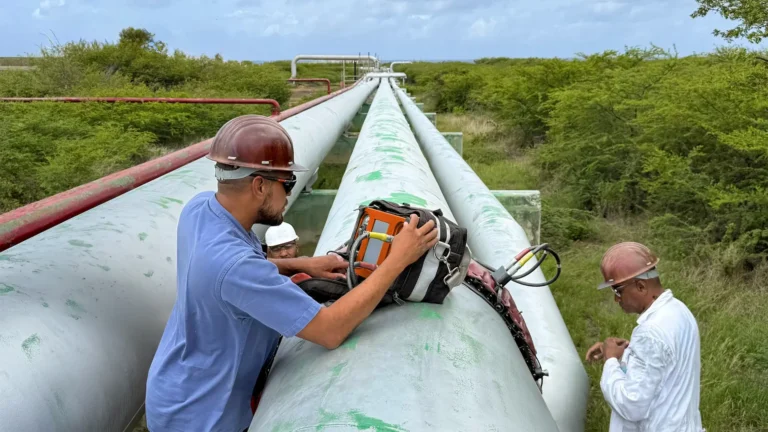
Screening was carried out using a Wavemaker® G4MINI with a 36‑inch inflatable ring (Figure 1) , while QSR1® was used for the follow‑up scanning (Figure 2). Based on the screening results, the evaluated sections were classified into three broad conditions: little or no damage, isolated areas of significant damage, and sections with a large number of defects. This made it possible to distinguish areas with limited responses from those where the number or severity of indications justified detailed measurement.
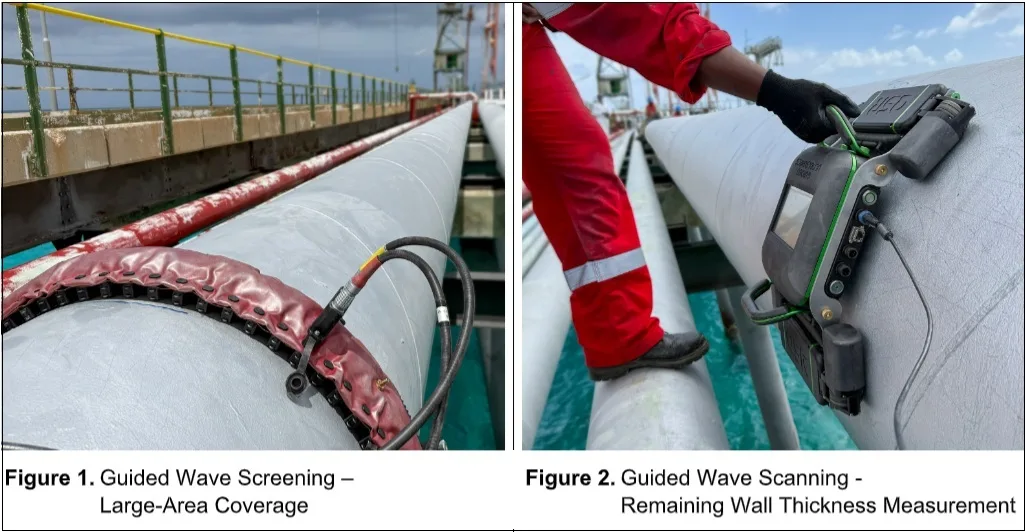
From an asset integrity standpoint, this differentiation helps prioritize inspection effort. Rather than applying the same level of prove‑up along the entire line, scanning can be focused where the screening results show it is needed.
Locating indications at the 6 o’clock position
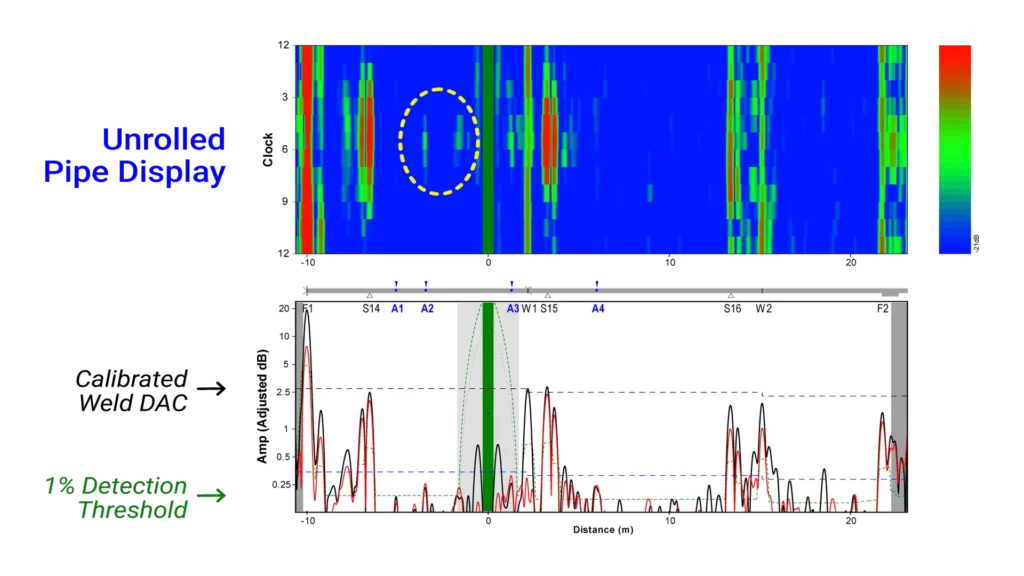
The Unrolled Pipe Display presents the screening data by virtually unwrapping the pipe, as though it had been cut lengthwise and laid flat, so the full circumference can be viewed at once( Figure 3) . This allows each indication to be located both along the pipe and around its circumference.
In the evaluated lines, this visualization identified a concentration of indications around the 6 o’clock position. This was particularly relevant because it matched the known history of corrosion and previous leaks recorded at the bottom of these pipes, while showing absence of damage elsewhere.
In this case, the deterioration was described as highly localized pitting associated with Microbiologically Influenced Corrosion (MIC). The screening located the affected areas, but identifying the damage mechanism relied on the asset history, morphology, operating conditions, and other available evidence.
Guided Wave Scanning: Measuring remaining wall thickness
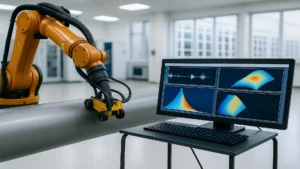
After indications were located with screening, the objective shifted from finding areas of concern to determining how much wall remained at those positions. Guided wave scanning was performed with QSR1® to measure remaining wall thickness where screening showed it was needed.
The spiral and longitudinal seam welds had to be considered when positioning the instrument. It was therefore positioned on the side of the pipe opposite these welds, allowing the areas of interest to be measured without interruption.
The follow‑up scanning focused on indications located around the 6 o’clock position. QSR1® scanned axially along the pipe over lengths between 30 and 100 cm, depending on the extent of the area identified during screening. With a beam width of 50 mm and 50 mm steps, the scans covered 100% of the bottom half of the evaluated sections. The reported scan speed was approximately six minutes per meter (Figure 4).
From frequency‑time analysis to wall‑thickness profile
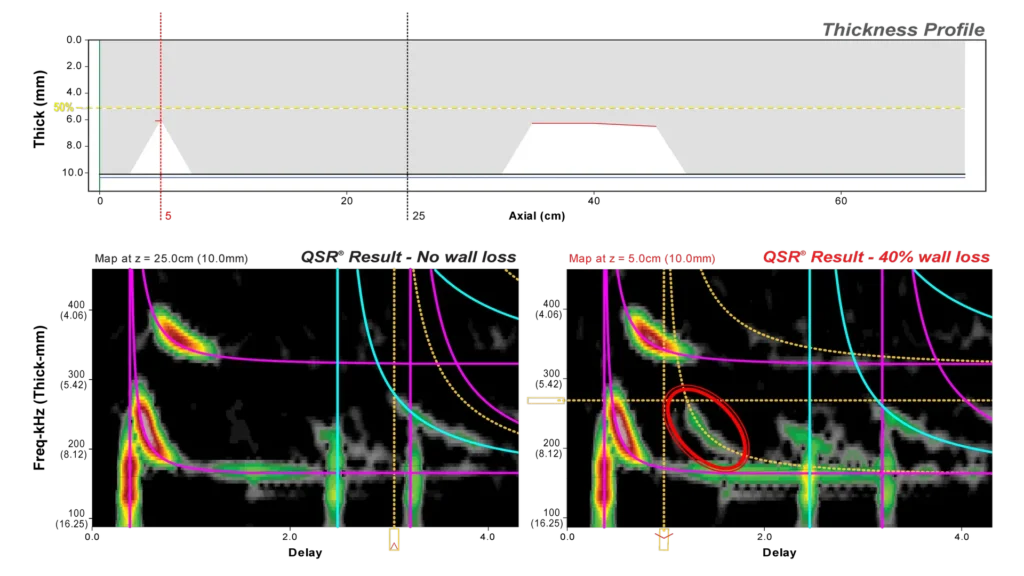
The primary output of guided wave scanning is the remaining wall‑thickness profile across the area examined. Each point on this profile is obtained from analysis of the frequency‑time plot, which shows how the shear‑horizontal guided wave modes used for scanning behave at that position.
In the frequency‑time plots, the vertical lines represent the non-dispersive SH0 mode, while the curved lines represent the dispersive SH1 mode. The lines shown in purple and blue indicate where reflections are expected for a healthy section. A defect produces an additional reflection that does not follow these expected lines. Defects below 50% wall loss produce an SH1 reflection only, while the deepest defects produce reflections from both SH1 and SH0.
Figure 4 illustrates how the frequency‑time plots relate to the resulting thickness profile. The upper graph presents the remaining wall‑thickness profile across the examined area. The first frequency‑time plot below shows an area with no appreciable wall loss and no additional reflections. In the second plot, the circled reflection indicates there is a thickness reduction at the 5 cm position in the scan. Fitting the yellow curve to this reflection determines a remaining wall thickness of 6.1 mm at that position, equivalent to approximately 40% wall loss.
From results to integrity decisions
With localized corrosion in large-diameter pipes, the challenge is not simply measuring wall loss but finding where detailed measurement will matter most. In the 36-inch lines case study, Wavemaker® screening narrowed the focus to the areas that warranted prove‑up, while QSR® scanning efficiently provided quantitative remaining wall-thickness measurements at those locations.
This avoided applying the same level of detailed measurement across the entire line. Instead, broad detection was used to direct targeted sizing, concentrating inspection effort on the areas that warranted it.
Those measurements can then be integrated with the pipe design, operating conditions, inspection history, damage mechanism, and applicable assessment criteria. This provides asset integrity teams with the information needed to assess the findings in context and decide where further action is required.
Advancing large-diameter scanning: QSR®-ALF
Inspections like the one described in the case study highlighted how large‑diameter pipes introduce a practical challenge when scanning away from the top of the pipe: the equipment must be positioned securely around the circumference while maintaining the controlled movement required for scanning. QSR®-ALF (Figure 5, an Adjustable Large‑diameter Frame), was developed to make scanning these areas easier.
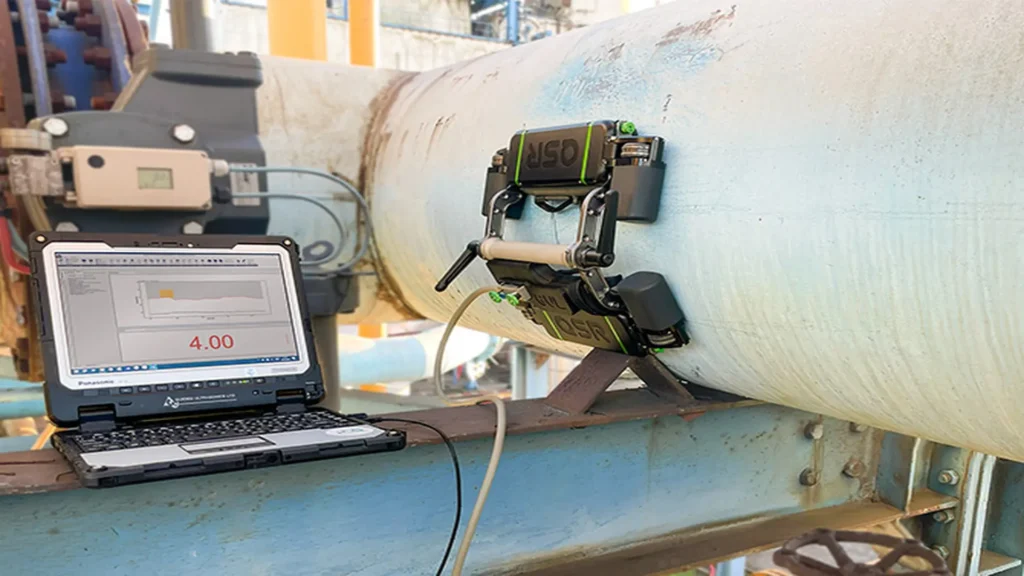
The frame separates the Sensor Carts from the ePOD, reducing the weight carried on the pipe and making it easier to position the sensors at different circumferential locations. Provided the coating is thin enough for the EMAT magnets to hold the assembly securely, the frame can be used on pipe diameters of 12 inches and above.
References
- Guided Ultrasonics Limited. Large Diameter Screening and Scanning. Case Study. 2025.
- ASTM International. ASTM E2775-16(2023), Standard Practice for Guided Wave Testing of Above Ground Steel Pipework Using Piezoelectric Effect Transduction.
- ISO. ISO 18211:2016, Non‑destructive testing – Long-range inspection of above-ground pipelines and plant piping using guided wave testing with axial propagation.
- Guided Ultrasonics Limited. New Frame for Scanning on Large‑Diameters: QSR®-ALF. 2026.