USA sets monthly record in LNG exports
In March 2026, the United States reached a new monthly high in LNG exports, recording 11.7 million metric tons. This figure exceeds the 9.94 million tons from February and also surpasses the previous record of 11.5 million reported in December.
The result confirms the country’s capacity to respond with volume in an international context marked by energy tensions, high sensitivity in maritime routes, and a demand increasingly dependent on providers with commercial flexibility.
Europe leads in receiving US LNG
Europe once again concentrated the largest reception volume, with 7.49 million tons, equivalent to nearly 64% of the total exported during the month. This behavior reaffirms the weight of the European market within the United States’ export strategy.
Geopolitical pressure in the Middle East and the need to ensure a stable supply continue to favor the arrival of US shipments to the continent. In this scenario, US LNG maintains value not only due to availability but also because of its speed of response to logistical or commercial disruptions.
Technical factors behind the export jump
The March record is not an isolated event. Behind the result is a combination of high utilization of liquefaction plants, the capacity to redirect shipments, and a spot demand that continues to reward players with greater operational flexibility.
The main data for the month supports this. The United States exported 11.7 million tons, of which 7.49 million went to Europe. Additionally, more than 1 million tons remained on vessels awaiting instructions or held near the entrance to the Suez Canal.
Furthermore, 11 vessels with a combined capacity of 880,000 tons remained in transit without a confirmed final destination, while another 4 vessels, with an additional 280,000 tons, remained anchored in the area. These movements reflect how maritime logistics continue to be a critical variable in price formation and shipment allocation.
Terminals sustain dispatch pace
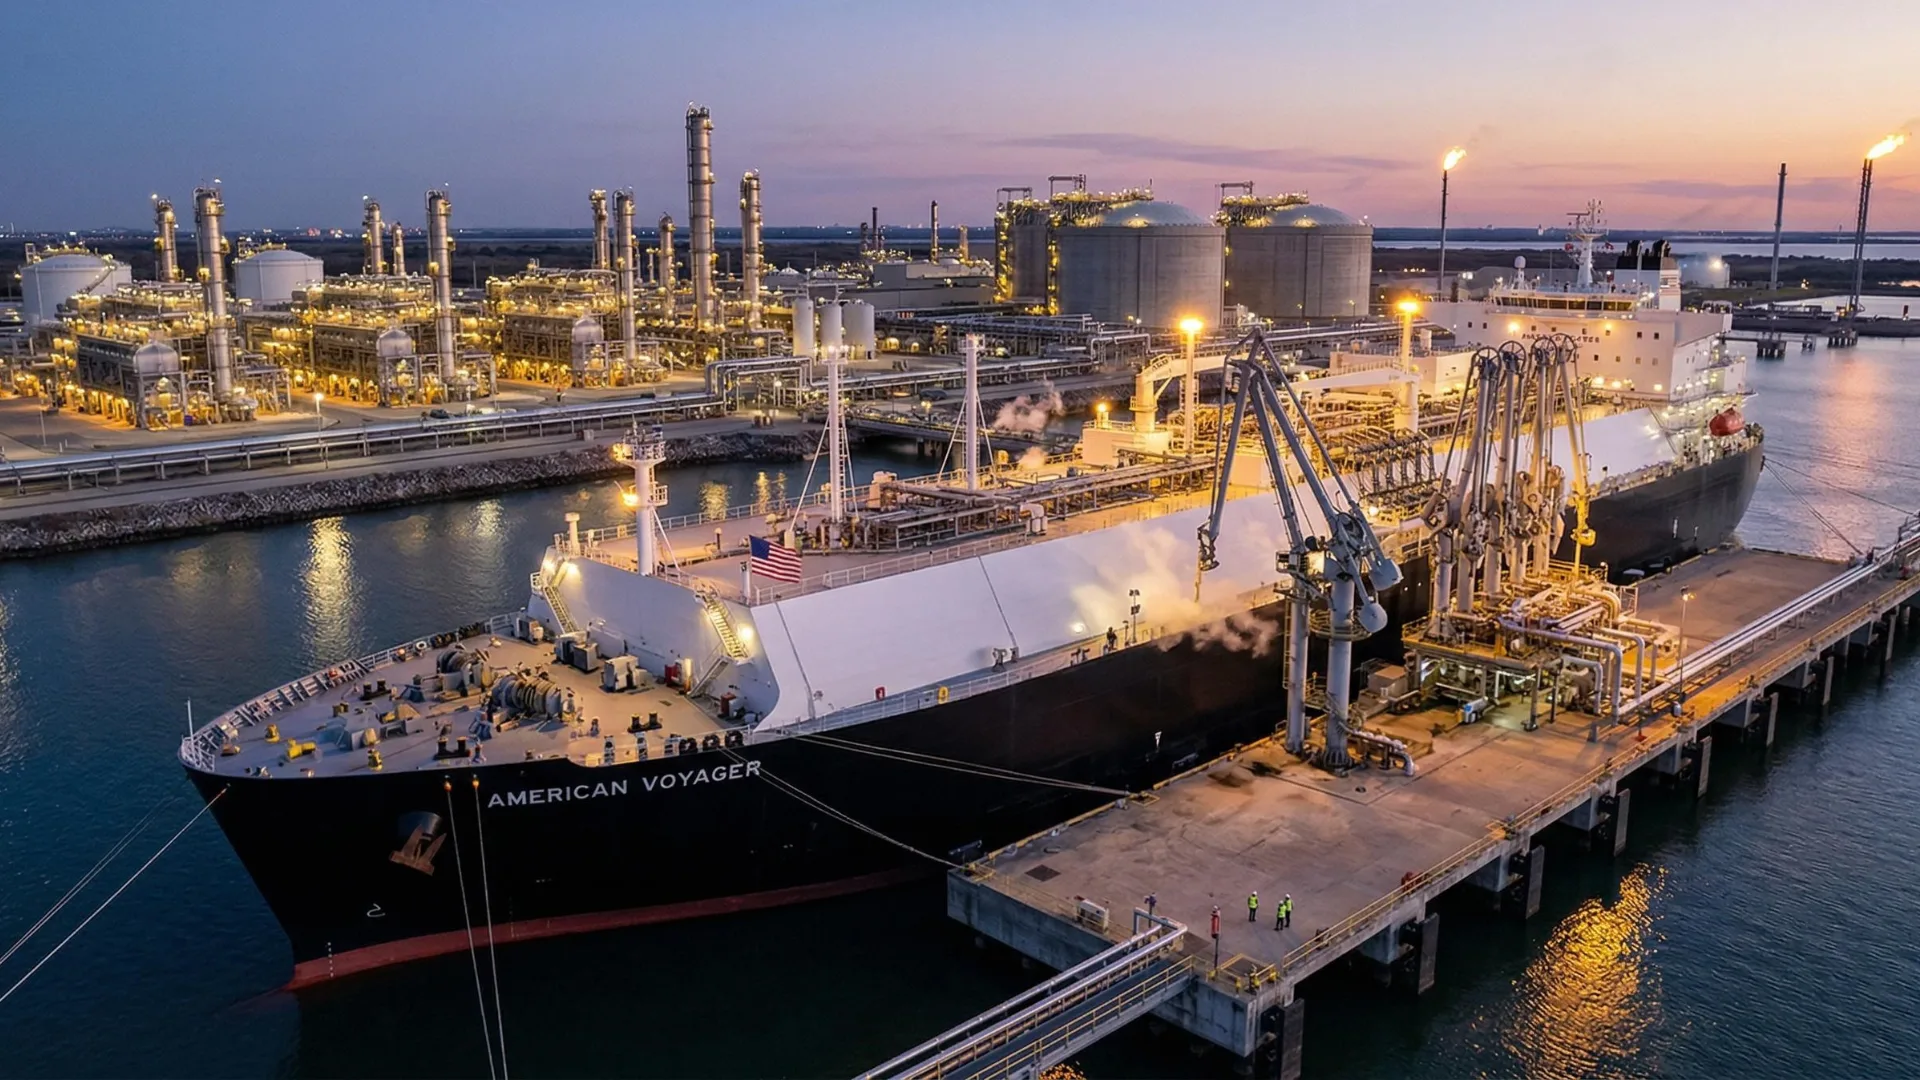
At the system’s operational base, terminals such as Sabine Pass, Corpus Christi, and Freeport sustained high loading levels during March. This performance was key to maintaining the export pace and responding to an international market with high volatility.
Added to this is the expectation for the progressive incorporation of new capacity, with projects such as Golden Pass LNG, whose impact could further strengthen the United States’ position in global liquefied natural gas trade over the coming months.
The market rewards commercial flexibility
From a commercial standpoint, US shipments maintain an advantage due to their ability to move toward markets with better pricing. Asia continued to show attractive signals, especially due to the JKM index differential, which reinforced arbitrage between regions and favored the repositioning of volumes.
This behavior confirms that the value of US LNG does not depend solely on the volume exported. It also depends on its ability to adapt quickly to price signals, route availability, and margin opportunities in rapidly changing markets.
Why this record matters to the energy sector
For senior management in the energy sector, this result confirms that the LNG business requires more than just installed capacity. The real advantage lies in combining infrastructure, operational reliability, and commercial flexibility to capture better margins in highly volatile environments.
For engineers, operators, and logistics teams, the takeaway is also clear. The reliability of the export system depends on terminals with high availability, sustained operational control, and precise management of dispatch windows, without compromising safety or continuity.
In market terms, March consolidates the United States as one of the strongest players in global LNG trade. Its strength lies not only in the volume it produces and exports but in its ability to respond when geopolitical uncertainty alters prices, routes, and purchasing decisions.
Temporary dominance or a new energy order?
The record of 11.7 Mt is not just a victory for the US trade balance; it is a direct message about the reconfiguration of the global energy map. However, this growth poses new challenges: Is global infrastructure prepared to absorb this level of dependence on a single provider? To what extent can commercial flexibility compensate for price volatility in the long term?
Source: GNL Global