Introduction
In the world of engineering and infrastructure maintenance, pipeline loop inspections ensure the safety, efficiency and reliability of these systems. Pipeline failures can have devastating consequences, from service interruptions to environmental and safety incidents, proactively identifying when and where inspections are required becomes a priority.
This is where statistical analysis emerges as a powerful tool, allowing engineers and technicians to identify critical points and plan pipeline inspections with a data-driven approach.
This article highlights the importance of performing evaluations in piping circuits, integrating data analysis applications for inspections and statistics in this process. We explore how these statistical methods are transforming the approach to pipeline inspections, leading to more effective and predictive management of this critical infrastructure.
By applying advanced techniques, traditional inspection methodology is being redefined, paving the way for practices that not only proactively prevent failures but also optimize the safety and durability of pipeline systems.
Importance of inspections in piping circuits
Pipelines are vital arteries for industry and society, transporting everything from drinking water to hazardous chemicals. However, like any infrastructure, they are subject to wear, corrosion and damage over time. Early detection of potential failures through regular inspections can prevent serious consequences, including environmental damage, significant economic losses and, in the worst case, humanitarian catastrophes.
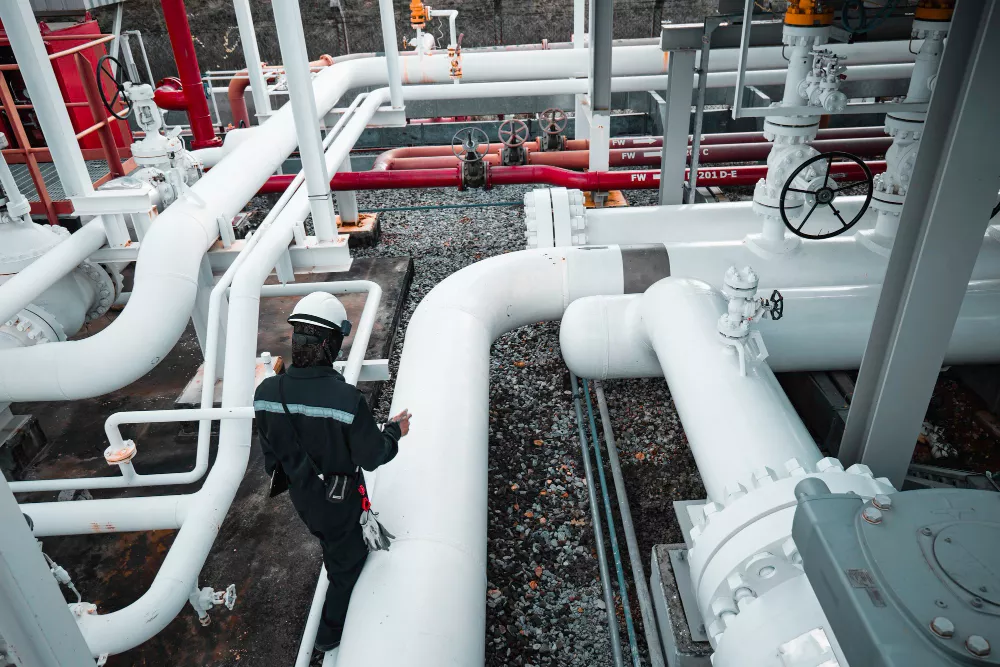
Performing piping circuit inspections efficiently requires an approach that goes beyond routine maintenance. The identification of critical inspection points (sections or components with the highest risk of failure), and the precise knowledge of the variables of the process or service provided, are at least some of the tools that allow organizations to direct their resources effectively, focusing inspection and maintenance efforts where they are most needed.
Here, statistical analysis of historical and operational data becomes an invaluable tool, providing a solid basis for making informed decisions on pipeline inspection planning.
Fundamentals of statistical analysis in inspections
Statistical analysis for the delineation of inspections in piping circuits is a method used to identify the sections of a piping system that require inspection, maintenance or repair.
Some operators define these circuits as corrosion loops , and generally delimits the circuit or loop, to the section of pipes and equipment that meet similar design and operability specifications, for example: A piping circuit that is located between the discharge of a pump and goes to some heat exchangers passing through some filters in a refinery, was designed to operate the entire circuit or loop at the same temperature, pressure, material of manufacture, thickness of withdrawal, allowable corrosion and other specifications.
Taking into account the delimitation of the corrosion circuit or loop, the statistical analyses are based on the collection and evaluation of data related to the condition and operation of these pipes and equipment, in order to determine the probabilities of failure or deterioration in different parts of the system to inspect and quantify the conditions under this methodology. The fundamental aspects of this model are presented below:
Data collection
The basis of any effective statistical analysis is comprehensive data collection. In the context of pipelines, this means meticulously recording everything from the material and age of the pipelines to the operating conditions under which they operate. Then the first step would be to gather information about:
- Material type: Different materials have different corrosion rates and resistance.
- Age of pipelines: The probability of failure generally increases with age.
- Operating conditions: Pressure, temperature and type of fluid conveyed.
- Maintenance and repair history: Information on previous interventions.
- Past inspections: Results of visual inspections, pressure tests, etc.
- Previous incidents: Record of failures, leaks, or any other type of incidents.
2. Statistical analysis
Key tools in pipeline system integrity management, enabling organizations to identify areas of potential risk and make informed decisions for maintenance and operation.
Once the data is collected, statistical analysis is performed to identify patterns, trends and correlations. This analysis may include:
2.1. Failure prediction analysis
The analysis of inspection data collected during the inspection process plays a key role in identifying critical points and planning future inspections. Data analysis techniques include:
- Image analysis: Digital image analysis of pipelines can help identify and characterize defects such as corrosion, cracks and deformations.
- Signal analysis: Acoustic, magnetic or other signal analysis can be used to detect defects inside pipelines without the need for direct access.
- Analysis of historical data: Analysis of historical inspection data can help identify deterioration patterns and predict the future evolution of defects.
- Failure prediction methods: These are statistical or machine learning techniques designed to estimate the probability of failure of components or systems based on historical data and operating conditions. These models use collected variables, such as pipe age, material types, environmental conditions, operating pressures, and past maintenance and failure records, to identify patterns and correlations that can predict future failures.
Common techniques include logistic regression, survival models, and neural networks, among others. The objective is to anticipate problems before they occur, enabling preventive interventions that minimize service interruptions and reduce repair costs.
2.2. Risk analysis
In the context of piping systems it focuses on assessing the risk associated with different sections of the system, considering both the probability of failure and the potential consequences of failure. This process involves two main components: the assessment of the probability of an adverse event occurring (such as a leak or rupture) and the assessment of the impact that such an event would have in terms of safety, environmental, and financial impacts.
The risk matrix, which cross-references the probability of failure with the consequences of failure, helps to prioritize mitigation and maintenance actions. For example, a section of pipeline carrying hazardous substances near a residential area would have a high level of risk if it has a moderate probability of failure due to the potential severe consequences.
Some of the most commonly used statistical methods for risk assessment in pipeline inspection include:
- Survival analysis: A method used to estimate the probability that a defect will not fail during a given period of time.
- Regression analysis: A method used to identify the factors that influence the probability of failure of a defect.
- Monte Carlo analysis: A method used to simulate the behavior of defects over time and estimate the probability of system failure.
2.3. Reliability analysis
It focuses on estimating the remaining useful life of the pipelines and the reliability of the system as a whole. It uses historical data and statistical analysis to determine the probability that pipelines and their components will function properly under normal operating conditions for a specified period of time.
Video explaining how to determine the date of the next inspection, and remaining life in pipes according to API 570. (Video courtesy of Sharky Training & Consulting Inc.)
This analysis can be based on failure rate models, such as the Weibull model, which considers how the probability of failure changes over time and under different conditions. Understanding reliability and remaining useful life is critical for planning replacements and renewals, as well as for establishing preventive maintenance programs to ensure the continued safe operation of the system.
These analytics, when implemented together, provide a comprehensive view of pipeline system integrity management, enabling organizations to make data-driven decisions to optimize performance, extend asset life, and ensure safety and environmental protection.
3. Delimitation of inspections
Based on the statistical analysis, circuits and sections of the piping system that have a higher risk of failure or are close to reaching the end of their expected service life are identified. This allows prioritizing inspections and maintenance in the areas that really need it, optimizing available resources and reducing the risk of incidents. The delimitation of inspections may involve:
- Identification of the circuit to be inspected: The identification of circuits or critical points is based on the detailed analysis of the data collected. Using risk analysis tools, such as Failure Modes and Effects Analysis (FMEA), experts can determine which sections of the pipeline are most likely to fail and the potential consequences of such failures.
For example, a section of pipeline that crosses an ecologically sensitive area could be classified as a critical point due to the high environmental consequences of a potential leak, even if its probability of failure is moderate.
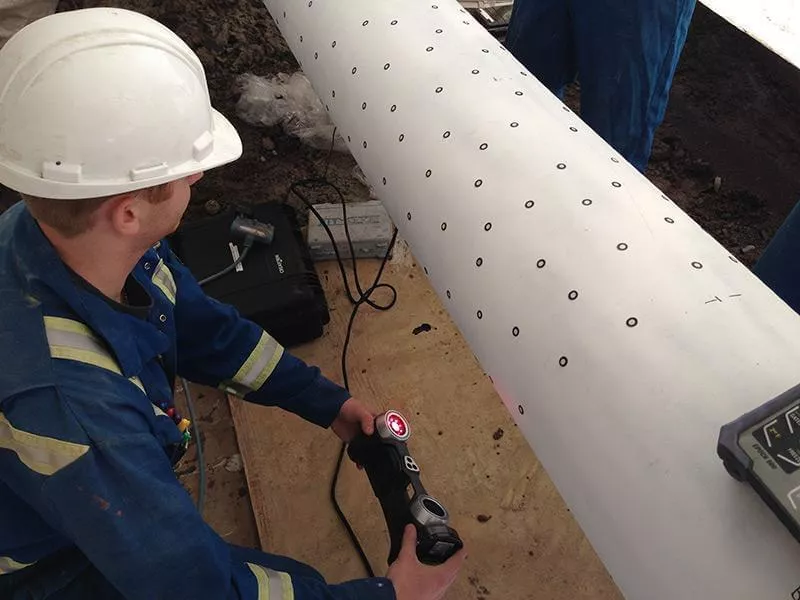
- Selection of inspection techniques: Depending on the risks identified, specific inspection methods and inspection techniques can be selected from the nondestructive testing methods and inspection techniques that apply. For example with the Ultrasound method, applying the pulse-echo technique for thickness measurement, the PAUT technique in defectology, visual inspections, among others. Fig. 2 shows the inspection of a pipe section using a 3D Scanner.
- Pipeline Inspection Planning: Armed with a thorough understanding of circuit and critical points and the probabilities of failure, managers can plan more effectively. This involves not only deciding when and where to inspect but also selecting the most appropriate inspection techniques for each case.
For example, for a pipeline with a high risk of internal corrosion, an ultrasonic inspection might be more appropriate than an external visual inspection. This data-driven approach ensures that the limited resources
- Preventive maintenance support scheduling: Establishment of a schedule for maintenance based on priority and risk.
- Replacement planning: Identification of sections that require replacement due to their advanced state of deterioration.
This statistical approach to inspection delineation helps ensure the safety and efficiency of pipeline systems, allowing organizations to make informed decisions based on hard data.
4. Limitations of statistical analysis
It is important to keep in mind that statistical analysis is not a foolproof tool. Some of the limitations of this analysis include:
- Data quality: Accuracy and reliability of historical inspection data is critical to obtain reliable results.
- System complexity: Statistical models may not be able to capture all the variables that influence the probability of defect failure.
- Uncertainty of the future: Statistical models are based on historical data and cannot predict future events with complete certainty.
5. Benefits of data analysis for inspections
The benefits of data analysis for pipeline inspections include:
- Improved inspection efficiency: Data analysis can help identify areas that require priority inspection, thus optimizing the use of resources.
- Cost reduction: Data analysis can help avoid unnecessary inspections in low-risk areas, which reduces inspection costs.
- Improved safety: Data analysis can help identify critical points with a higher probability of failure, allowing preventive measures to be taken to avoid accidents.
- Improved system reliability: Data analysis can help identify and correct the causes of defects, which improves the reliability of the piping system.
Conclusion and future directions
Statistical analyses for the delineation of pipeline loop inspections are becoming established as standard industry practice for pipeline loop delineation, enabling critical point identification and risk-based pipeline inspection planning.
By applying statistical and data analysis techniques, organizations can now more accurately predict the probability of failure, identify critical points with a high risk of deterioration and optimize their inspection and maintenance programs. This approach not only improves safety and operational efficiency but also contributes to more sustainable and economical resource management.
The value of statistical analysis lies in its ability to transform large volumes of raw data into actionable information. By integrating historical, operational and inspection data, statistical models allow engineers to discern patterns and trends that would be impossible to detect using traditional methods. This leads to a better understanding of pipeline conditions and more informed decisions on where, when and how to perform inspections and preventive maintenance.
Find out how to prevent failures now!
References
- API 570: Piping Inspection Code
- ASME B31.G: Manual for Determining the Remaining Strength of Corroded Pipelines
- NACE International Standard RP0285-2002: Standard Practice for Corrosion Control of Underground Storage Tank Systems
- ISO 17636:2017: Nondestructive testing of welds.
- API 574: Pipeline Inspection Practices.
- Predictive 21. Determination and optimization of condition monitoring areas (CML’s)