
Liquefied Natural Gas (LNG) is now one of the cornerstones of global energy trade. With demand exceeding 404 million metric tons per annum (MTPA) in 2022 and projections pointing toward 700 MTPA by 2040, the pressure on operators to maximize availability and minimize product losses across the entire value chain is simply imperative (International Energy Agency [IEA], 2023). A single day of unplanned downtime at a mid-scale liquefaction plant—between 3 and 6 MTPA—can represent gross losses exceeding USD 5 million, not including opportunity costs from unmet take-or-pay contracts.
Understanding the LNG Value Chain in its full technical complexity is therefore an operational necessity. From upstream gas production to the end user, each link introduces risk variables that, if not managed with methodological rigor, translate into production losses, asset degradation, and increasing regulatory exposure.
Anatomy of the LNG Value Chain
Upstream gas: The foundation everything that follows
Upstream gas encompasses exploration, drilling, production, and primary treatment of natural gas in conventional and unconventional reservoirs. At this stage, raw gas composition is critical: CO₂ contents above 2 mol%, the presence of H₂S, mercury, and heavy fractions (C₅₊) represent contaminants that must be reduced to specification levels before feeding the liquefaction train. Typical feed specifications require, for example, less than 50 ppmv CO₂ and mercury traces below 0.01 μg/Nm³ to protect aluminum heat exchangers (GPSA Engineering Data Book, 2012).
Gas losses in upstream operations are dual in nature: fugitive and operational. Fugitive methane emissions—the primary component of natural gas—represent between 1.4% and 3.7% of total production in conventional basins, according to data from the Environmental Defense Fund (Alvarez et al., 2018). This is not only an environmental concern; it is gas that never becomes marketable product, and therefore a direct monetizable loss. Consequently, leak detection and quantification using infrared (FLIR) cameras and LDAR (Leak Detection and Repair) sensors is now considered the minimum acceptable standard in upstream operations linked to LNG value chains.
LNG liquefaction: The heart of the process
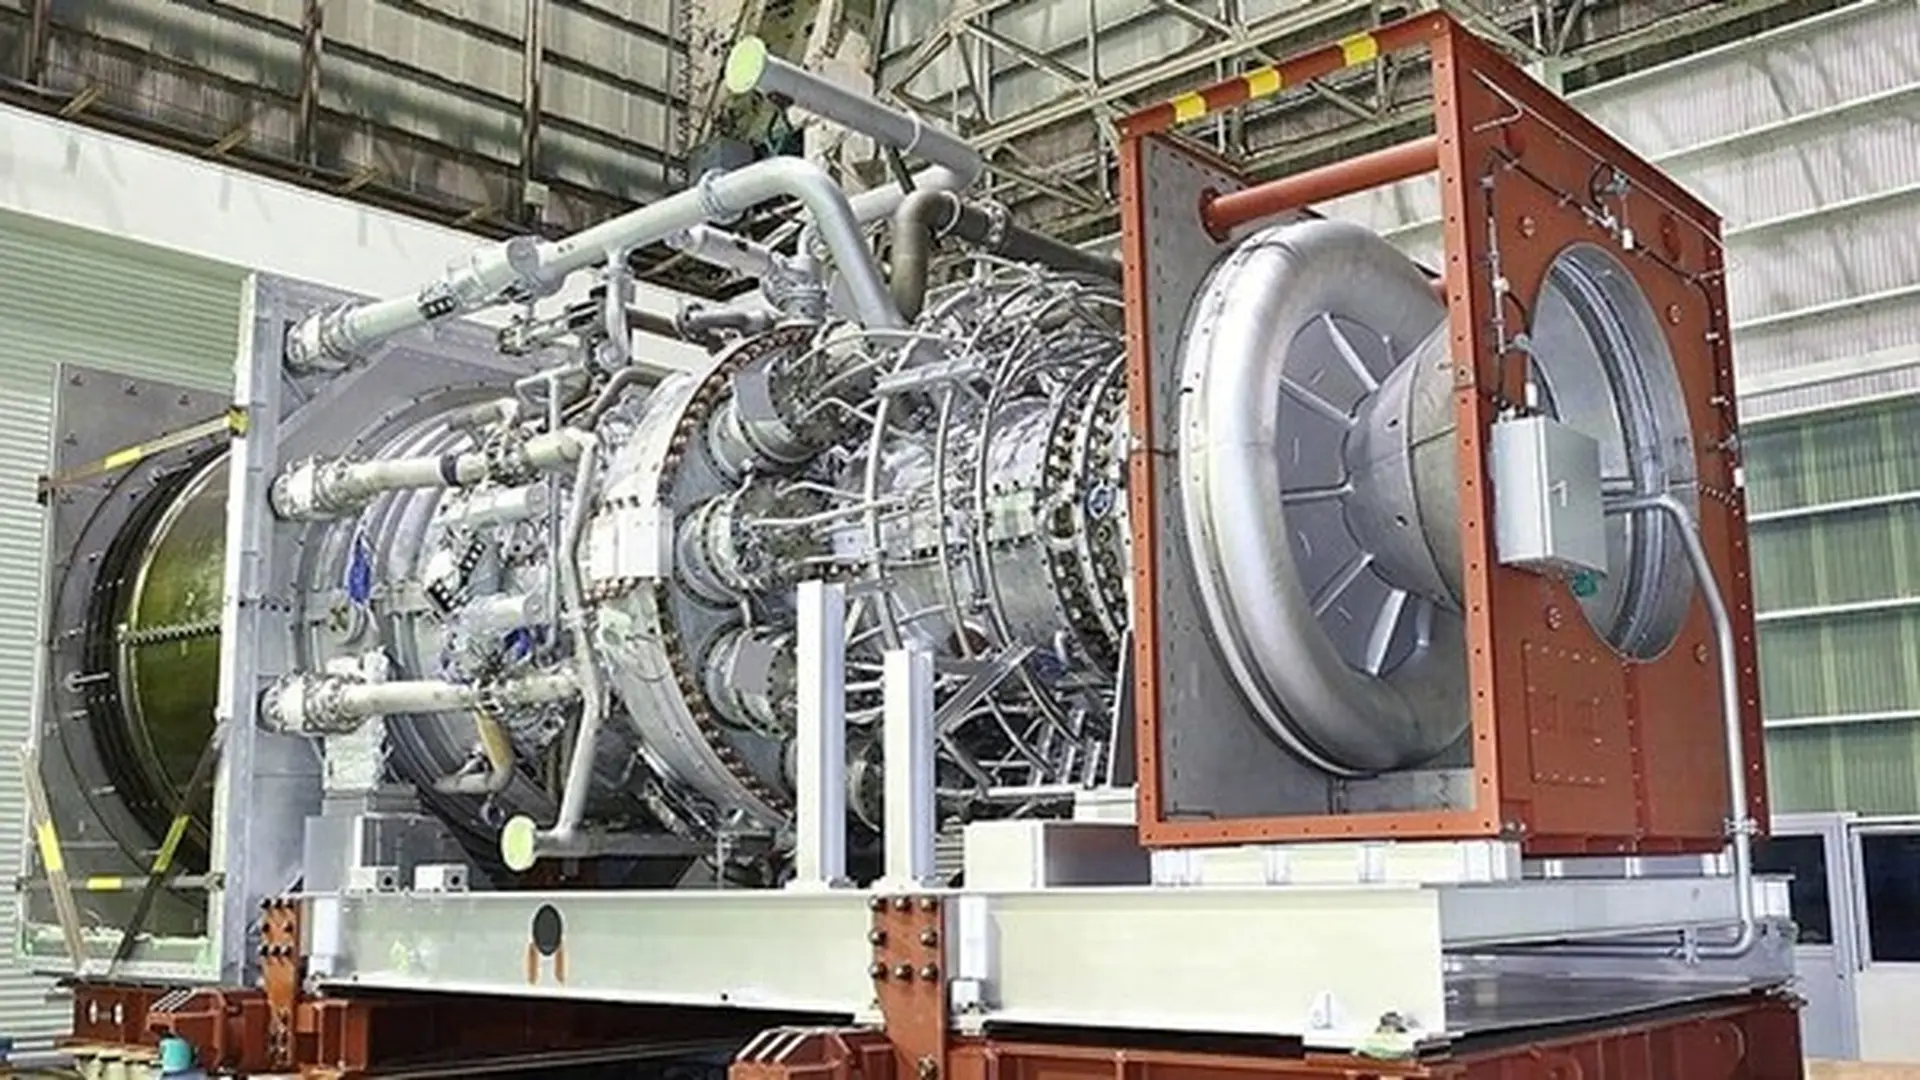
LNG liquefaction is the most energy-intensive and technologically complex stage of the value chain. The process cools natural gas to approximately -162°C at atmospheric pressure, reducing its volume by a ratio of 600:1. The predominant refrigeration cycles are the Mixed Refrigerant Cycle (MRC or SMR), typically used in smaller-scale plants, and the Propane-Precooled Mixed Refrigerant (C3-MR) process, which dominates large-scale facilities with trains exceeding 4 MTPA (Lim et al., 2013).
Energy consumption for liquefaction typically ranges between 0.28 and 0.45 kWh/kg of LNG produced, depending on process configuration, feed conditions, and ambient temperature. Industrial gas turbines—such as GE Frame 7 and Siemens SGT-800—drive the main compressors and, together with aluminum plate-fin heat exchangers (PFHE), represent the most critical assets with the highest failure impact. Unavailability of the main compressor can reduce production to 0% within minutes (Mokhatab & Mak, 2013).

LNG terminal: The transfer node
The LNG terminal, whether for export or import, is the physical interface between onshore production and maritime transport. It includes cryogenic storage tanks (typically full-containment tanks made of concrete and 9% nickel steel, with capacities ranging from 80,000 to 220,000 m³), marine loading arms (MLA), boil-off gas (BOG) management systems, and reliquefaction units.
Interoperability between vessel and termina, arm compatibility, transfer rates, vapor pressures—is an operational factor that, when not properly managed, generates measurable delays. According to the Society of International Gas Tanker and Terminal Operators (SIGTTO, 2021), non-productive berth time represents between 8% and 15% of total terminal time in suboptimal operations, with demurrage costs exceeding USD 80,000 per day for Q-Flex and Q-Max vessels.
Transportation and regasification
Modern LNG carriers—membrane-type (GTT Mark III, NO96) or Moss-type—transport LNG in tanks at -162°C with high-efficiency insulation systems that limit natural boil-off rate (BOR) to between 0.08% and 0.15% of cargo volume per day. Regasification plants, in turn, convert LNG back to its gaseous state using Open Rack Vaporizers (ORV), Submerged Combustion Vaporizers (SCV), or compact heat exchangers, and inject it into distribution networks at pressures between 40 and 80 bar.
Evaporation gas: The quietest loss
Boil-Off Gas (BOG) is the most pervasive manifestation of loss in the LNG value chain. It is continuously generated in storage tanks, during transfer operations, in ship manifolds, and along cryogenic lines, as an inevitable consequence of heat flow from the environment into the fluid at -162°C.
In onshore storage tanks, a typical BOR of 0.05% vol/day in a 160,000 m³ tank equates to approximately 80 m³ of LNG lost daily—around 48,000 Nm³ of gas—if not actively managed.
BOG management strategies include:
- In-situ reliquefaction using high-speed screw or centrifugal compressors
- Use of BOG as fuel for plant turbines or dual-fuel vessel propulsion systems
- Direct injection into high-pressure grids when composition and gas quality permit
The selection among these options depends on economic balance: reliquefaction cost (energy + compressor maintenance) versus spot LNG market value (IEA, 2023).
Technical challenges in reducing downtime
Predictive maintenance and asset integrity management
The greatest challenge in reducing unplanned shutdowns is not technological—it is organizational and data-driven. Modern LNG plants operate thousands of process sensors—temperature, vibration, pressure, flow—generating data volumes exceeding 1 TB per day. However, the ability to convert that data into actionable signals remains limited in many operations.
Predictive maintenance based on machine learning models—specifically applied to vibration signatures of centrifugal compressors and turboexpanders—has demonstrated reductions in unplanned compressor downtime of up to 35%, according to studies published by Machinery Failure Prevention Technology (MFPT) and reviewed in the Journal of Engineering for Gas Turbines and Power (Al-Rashidi & Stokes, 2020).
Cryogenic system integrity—comprising AISI 304L and 316L stainless steel piping, cryogenic globe and butterfly valves with PTFE seats, perlite or polyurethane foam insulation—requires periodic non-destructive testing (NDT), including infrared thermography to detect insulation losses, ultrasonic thickness measurement for corrosion under insulation (CUI), and acoustic emission for early crack detection in high-criticality welds, in accordance with API 653 (2020 edition).
The challenge of planned shutdowns (Turnarounds)
Planned maintenance shutdowns (Turnarounds, TAR) in LNG facilities represent a combinatorial optimization challenge: duration must be minimized without compromising safety or work scope. In large-scale plants, each additional day of shutdown represents between USD 4 and 8 million in deferred production.
Industry trends include extending TAR intervals—from four to six years—through online maintenance strategies, redundancy in critical rotating equipment, and adoption of longer-life materials and coatings in compressor and turbine internals (Mokhatab & Mak, 2013).
Digitalization of TAR through Digital Twins enables more precise pre-planning, identification of parallel work interferences, and critical path optimization. Platforms such as AVEVA, AspenTech, and Hexagon have developed specific solutions implemented in LNG plants in Australia (Gorgon, Wheatstone) and Qatar (Ras Laffan).
Human factors and operational errors
Human error remains the root cause of 20% to 30% of operational incidents in process facilities, including LNG plants (Energy Institute, 2020).
Effective strategies extend beyond technical training and include:
- Redesign of Human-Machine Interfaces (HMI) under ISA-101 standards.
- Alarm management systems compliant with ISA-18.2, maintaining standing alarms below 10 per operator under normal conditions.
- Cross-verification procedures under Management of Change (MoC) for any process modification.
Below, we examine strategies for mitigating operational errors and critical alarms that lead to costly plant shutdowns.

Emerging technologies and their real impact
The Industrial Internet of Things (IIoT) and real-time connectivity are transforming operational management across the LNG value chain. Distributed fiber optic sensors (DTS/DAS) enable real-time monitoring of cryogenic pipeline integrity, detecting thermal anomalies over distances of up to 30 km with 1-meter spatial resolution.
Inspection drones equipped with thermographic cameras and hydrocarbon detectors allow elevated structures, tanks, and pipelines to be inspected without scaffolding or production shutdown, reducing inspection costs by 40% to 60% compared to conventional methods (IEEE Transactions on Industrial Electronics, 2022).
Artificial intelligence applied to process signal analysis—using recurrent neural networks (LSTM) trained on historical operational data—has demonstrated the ability to anticipate compressor failures with a 48- to 72-hour prediction window and false-positive rates below 5% under steady-state operation. This window is sufficient to prepare spare parts, coordinate maintenance teams, and plan controlled shutdowns instead of abrupt failures with unpredictable consequences.
Conclusions
Reducing downtime and losses in the LNG value chain does not admit one-size-fits-all solutions. Each link from upstream gas to LNG terminals—has its own vulnerabilities and improvement levers.
What is universal, however, is the guiding principle: precise technical information, managed under robust methodologies and supported by appropriate technology, is the most valuable asset for an LNG operator in the 21st century.
Active BOG management, data-driven predictive maintenance, optimized planned shutdowns through Digital Twins, and systematic reduction of human error are not trends—they are already the practices that separate world-class operators from the rest.
With global LNG demand steadily and irreversibly growing, and supply contracts increasingly demanding reliability, operational efficiency is no longer a competitive advantage—it is a survival requirement.
References
- Al-Rashidi, M., & Stokes, R. (2020). Predictive maintenance of centrifugal compressors in LNG facilities using machine learning techniques. Journal of Engineering for Gas Turbines and Power, 142(9), 091007. https://doi.org/10.1115/1.4047201
- Alvarez, R. A., Zavala-Araiza, D., Lyon, D. R., Allen, D. T., Barkley, Z. R., Brandt, A. R., … & Hamburg, S. P. (2018). Assessment of methane emissions from the U.S. oil and gas supply chain. Science, 361(6398), 186–188. https://doi.org/10.1126/science.aar7204
- American Petroleum Institute. (2020). API Standard 653: Tank Inspection, Repair, Alteration, and Reconstruction (6th ed.). API Publishing Services.
- Energy Institute. (2020). Human factors in the process industries: Lessons from accidents (3rd ed.). Energy Institute Press.
- Gas Processors Suppliers Association (GPSA). (2012). Engineering data book (13th ed., Vols. 1–2). GPSA.IEEE Transactions on Industrial Electronics. (2022). UAV-based inspection systems for industrial infrastructure: A survey. IEEE Transactions on Industrial Electronics, 69(4), 3998–4014. https://doi.org/10.1109/TIE.2021.3084177
- International Energy Agency. (2023). Gas market report Q2-2023: Focus on LNG. IEA. https://www.iea.org/reports/gas-market-report-q2-2023
- Lim, W., Choi, K., & Moon, I. (2013). Current status and perspectives of liquefied natural gas (LNG) plant design. Industrial & Engineering Chemistry Research, 52(9), 3065–3088. https://doi.org/10.1021/ie302921p
- Mokhatab, S., & Mak, J. Y. (2013). Handbook of liquefied natural gas. Gulf Professional Publishing / Elsevier.
- Society of International Gas Tanker and Terminal Operators (SIGTTO). (2021). LNG terminal operations: Recommendations for ship/shore interface. SIGTTO Publications.