
Introduction
Reliability Centered Maintenance (RCM) is a process used to determine the policies that should be taken to ensure that an asset continues to perform its function in the asset’s current operating context and in the most cost-effective manner possible. It achieves this by identifying the asset’s function, functional failure and associated failure modes, determining effective preventive maintenance policies that can be implemented in a cost-effective and efficient manner to reduce the probability of failure.
In addition, RCM encountered major limitations in the way we interpreted the nature of how failures occurred. In this article we will describe how the transition occurred between the ways we thought failures occurred until the 1960s and the ways RCM developed them to show us the new RCM Failure Patterns, the new logic of looking at maintenance.
First generation of failure patterns
With the industrial revolution machines appeared and with their failures appeared the first efforts of “Maintenance”. Initially all maintenance was corrective. Machines were used and with the passage of time, the effort (loads/cycles, erosion, corrosion, fatigue, etc.) exceeded the resistance (designs/robustness, materials, etc.) and generated looseness, cracks, overheating, among other failure mechanisms and the equipment failed.
These failures could be of low intensity and in those cases the repairs and return to service were of short duration and of low economic impact. But at other times the failures were much more severe and sometimes catastrophic. For this reason maintenance people began to realize that certain failures (failure modes as they are known today) occurred with a more or less known “Failure Frequency” and, therefore, some kind of intervention could be established as close to the date at which a failure could be anticipated to occur, which they called “useful life”.
These cyclical interventions were called “Preventive Maintenance” and the graphical representation of their behavior is what is now known as the “First Generation of Maintenance1“.
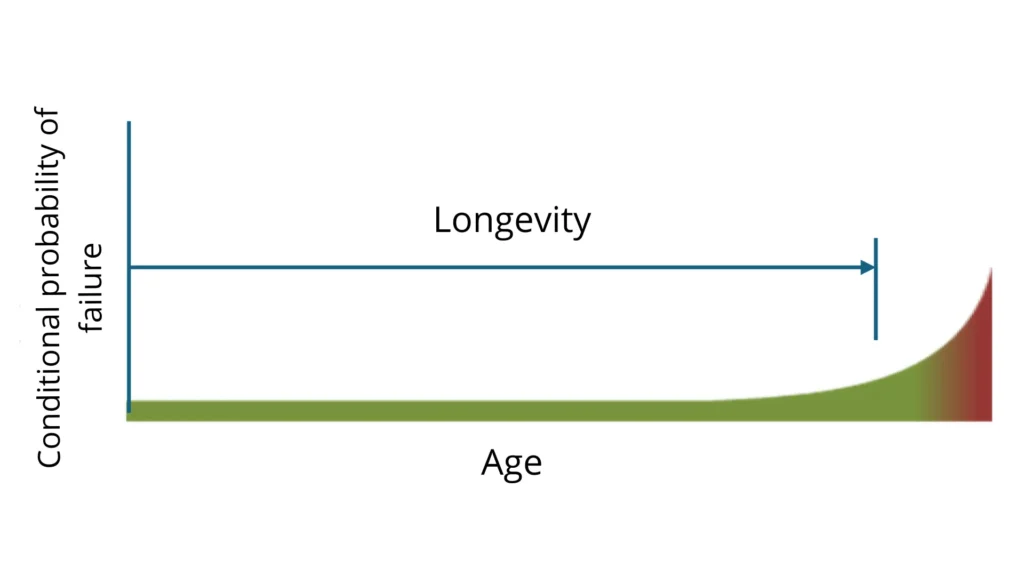
The X-axis represents the “Age”, which can be time, km, cycles, units produced, etc. The horizontal Y-axis represents the “Conditional Probability of Failure”. We will define this term later.
As can be seen, this failure pattern, also known as the “Traditional Approach” or “Wear-Out”, shows a period of low conditional probability of failure and at the end of a relatively known longevity, there is a sudden increase in this probability of failure. Operating after this period would be very risky for the physical integrity of the elements that make up the machinery. Because of this, then, a service or replacement is scheduled to restore the condition of these components on a cyclical basis, so that they can be expected to operate reliably in the next cycle.
Due to the simplicity and robustness of the first machines, this pattern seemed acceptable to all because it used to allow a more planned and more economical operation by avoiding in many cases failures and their consequences.
Second generation of failure patterns
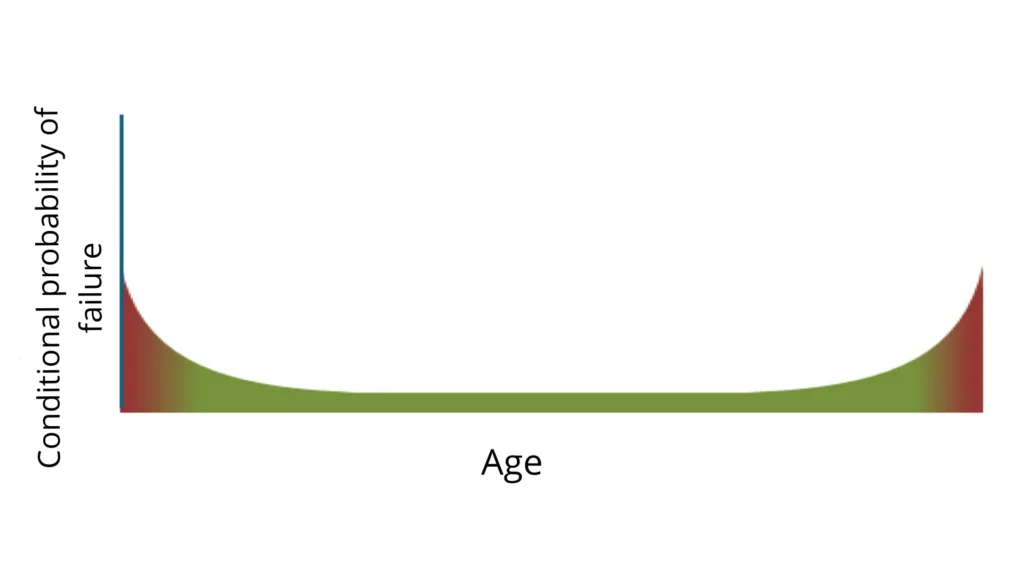
The subsequent cycles of installation, operation, maintenance (preventive or corrective), operation and so on, brought about what we would later come to know as “infant mortality”. That is, the failure right at start-up of equipment whose components were not properly assembled initially. By bad assembly we mean: inadequate adjustments, looseness, tightening, alignment. Or materials of inadequate quality/type. Inadequate assembly sequences. The duration times of infant mortality are variable. From seconds in electrical or electronic equipment to a few days in some robust mechanical equipment.
The common factor that surrounds components with infant mortality is complexity or any other situation where there is a high probability of things going wrong during commissioning. The following graph shows the resulting pattern of known life with infant mortality. This failure pattern, known as the “Bathtub Curve” is recognized as the Second Generation Failure Pattern.
Limitations of conventional failure pattern analysis
For many years it was thought that you had maintenance explained with these two failure patterns. And well into the 1960s, traditional thinking suggested that extensive failure records could be used to determine the useful life of most components and preventive maintenance could be scheduled shortly before equipment failure.
It was believed that there is always a direct relationship between reliability and operational age and that the more frequently an element is intervened, the lower its probability of failure.
These paradigms are still entrenched in many organizations today. But this changes radically when we understand each of the 6 Failure Patterns (A through F) from the study by Howard Heap and Stanley Nowlan of United Airlines (condensed in the “RELIABILITY CENTERED MAINTENANCE” Report published in December 1978).
Classification of RCM failure patterns
If the nature (pattern) of a failure mode is not understood, the strategy to avoid or mitigate it will have the same result as throwing darts blindfolded. In this article we wish to clarify some aspects of these patterns that are not always well understood. Let us begin by mentioning and briefly describing them.
Note: When we mention probability of failure we refer to the conditional probability of failure. In the context of reliability centered maintenance, conditional probability of failure is defined as the probability that an asset will fail within a specific time interval, given that it has not failed up to that point.
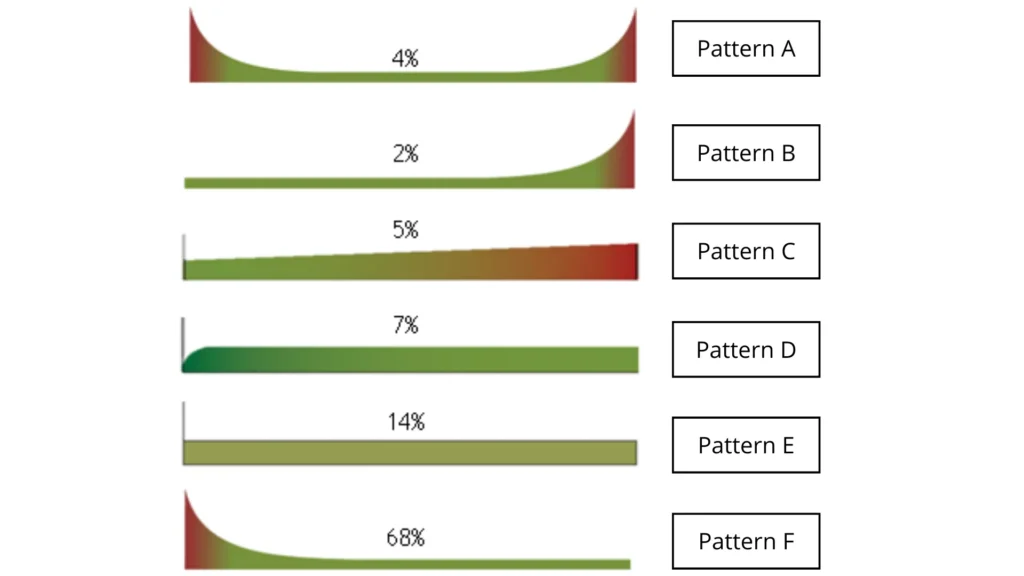
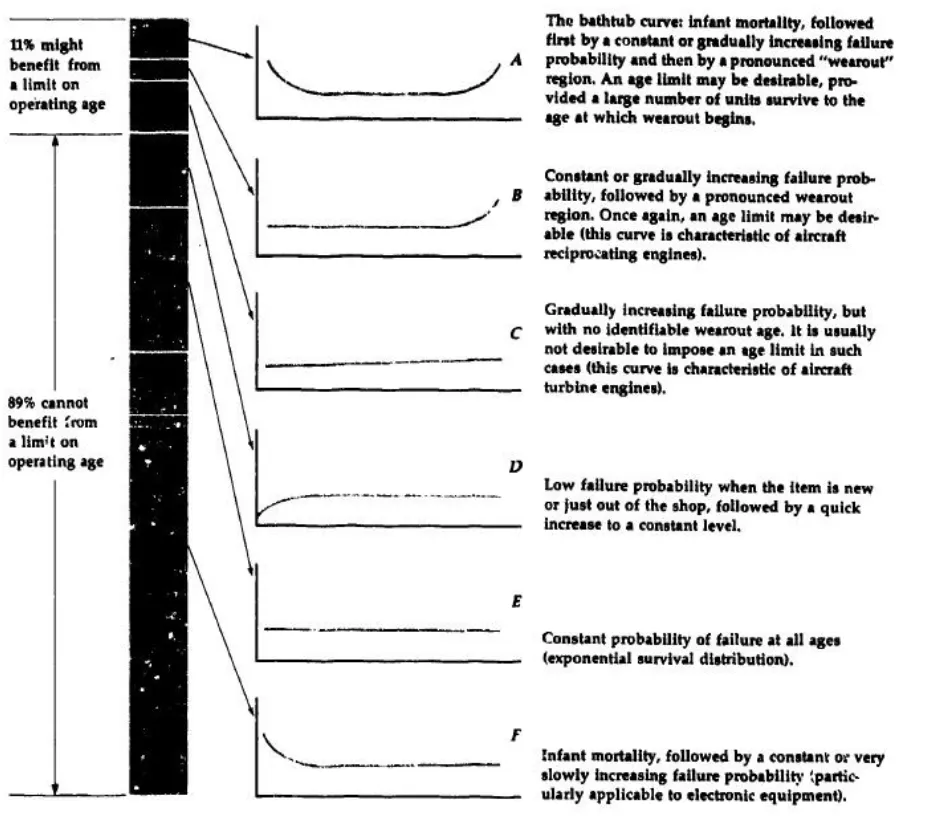
- Pattern A “Bathtub Curve”: Shows a high initial failure probability, followed by a continuous phase of random failure probability, ending in a zone of abruptly increasing failure probability. RCM assigns 4% of the total failures to this pattern.
- Pattern B called “Traditional Approach”, “Known Life” or “Deterioration Pattern”: Starts with a continuous phase of low probability of random failures, culminating in a zone of abruptly increasing failure probability. RCM assigns 2% to this pattern.
- Pattern C “Fatigue”: Progressive increase in the probability of failure, but without a clear phase of sudden increase. RCM assigns 5% to this pattern.
These three patterns, which account for 11% of the total failures of an installation, are related to the age of the components.
- Pattern D “Best New”: Shows very low probability of failure at the beginning of operation and then rides a continuous phase of random failures. RCM assigns 7% to this pattern.
- Pattern E “Random”: Shows constant probability of random failures during the entire life of the component. RCM assigns 14% to this pattern.
- Pattern F “Infant Mortality”: Shows a high initial probability of failure, followed by a phase of constant random probability of failure during the remaining life of the component. RCM assigns 68% to this pattern.
What do failure patterns teach us?
So far we can mention that we interpreted in a very limited way the nature (patterns) in which components could fail. And that only by understanding this nature will we be able to design appropriate policies to manage the failure modes of any asset.
Looking at the patterns, with the exception of fatigue pattern C, we note that there are three very well defined regions. The first phase, present in patterns A and F, shows infant mortality. It is then followed by a phase of constant conditional probability of failure and in patterns A and B we observe that they end with a sudden increase in the conditional probability of failure.
Regarding infant mortality, many people confuse this high conditional probability of failure with real failures. If this were the case, the aircraft industry, where its components have 70% infant mortality (sum of A and F patterns) would not be the safest means of transportation in the world. The high initial conditional probability of failure is attributed to complex components with many connections, microcomponents and/or very strict requirements of assembly sequence, equipment connection, alignment, torque, clearances, and resistant materials, among others.
So what does the aerospace industry do and what should we do with our equipment to prevent the high probability of failure from becoming failures? Well, maximize efforts to identify failure modes that meet this pattern and avoid infant mortality failures in two ways. One, strictly comply with equipment assembly and connection procedures, alignment, torque, clearances, trained personnel, good quality materials/spare parts, and proper testing and start-up protocols.
This will avoid equipment start-up with the typical results of equipment that, operating stably, we intervene on the weekend and it takes until Wednesday to stabilize it.
The second way to avoid the effects of infant mortality is to avoid unnecessary interventions (over-maintenance) that lead to the same high probability of initial failure every time we intervene in the equipment.
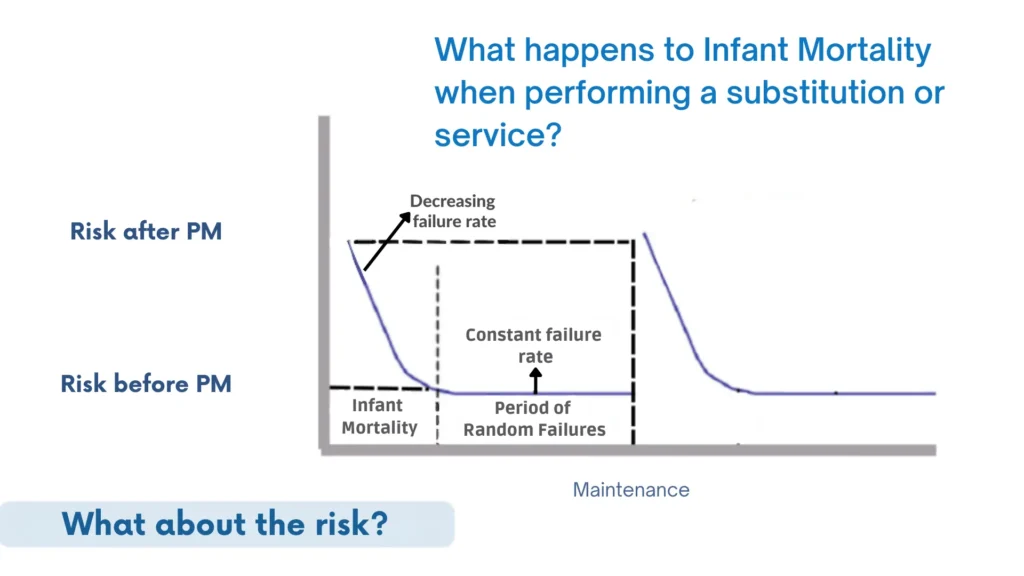
It should also be noted that the more invasive the intervention (more components are disassembled and replaced), the greater the probability of failure.
Where cyclic failure patterns (A, B or C) are identified, a cyclic replacement or service task will tend to be applied. And where a random pattern is identified, a condition-based task will tend to be applied. The RCM decision tree will support in selecting these actions or others such as fault finding, operate to failure or changeovers.
In random patterns, tasks with age-associated frequencies do little to improve the cost-effective performance of a team.
Special consideration with pattern B
In practice, pattern B is mainly identified in asset elements that are in direct contact with the product, where friction, corrosion, evaporation, abrasion, and erosion phenomena exist, under uniform and constant stresses. Periodic replacement or restoration may be appropriate.
But what happens if a piece of equipment has several components with failure modes that follow Pattern B? Surely the useful life estimation will tend to a variety of different ages (longevity of the components) that will force to form a preventive maintenance schedule with stops every X amount of hours and where all the activities related to components whose service and/or replacement cycles are similar are grouped together.
For this reason, after an RCM analysis, although it is expected that the number of activities will be reduced and many cyclic replacement tasks will be changed to a condition-based replacement, maintenance frequencies, for example, every 2000, 8000, and 16000 hours, will certainly be maintained.
Conclusion
The knowledge of the Failure Patterns is the logical way to do maintenance. It became clear to us that in order to design policies for handling any failure mode we must know its “nature” (Failure Pattern), otherwise we would be betting on chance in the selection of these policies. This, of course, will result in lower reliability and high maintenance costs. Knowing the Failure Patterns in depth has been one of the major advances obtained by maintenance organizations globally.
References
- Amendola, L., Operational reliability. 2011.
- F. Stanley Nowlan and Howard F. Heap, “Reliability Centered Maintenance”. December 29, 1978, U.S. Department of Commerce, National Technical Information Service. Produced by Dolby Access Press.